7.1.3. Wave monitoring
7.1.3. Wave monitoring
Through the Wave monitoring, the information related to the waveform of welding data will be displayed, making it possible to grasp instant information as well as past information of welding at one glace. The function will help filter out the current and voltage supplied by the welder, and will display their waveforms. The function will also show the average of the current/voltage values calculated in one welding process (ARCON-ARCOF) and also their deviation. In addition, this function will display the upper and lower limits of the current and voltage set in the welding start condition as well as the time during which the limits are exceeded.
The waveform monitoring function makes it possible to make the waves larger and smaller and move them in the left or right direction. Moving the wave will make it possible to check the wave created up to 100 seconds earlier within the range of 0 ~ 500 A or 0 ~ 50 V. Refer to [7.14 Operation] for operation description.
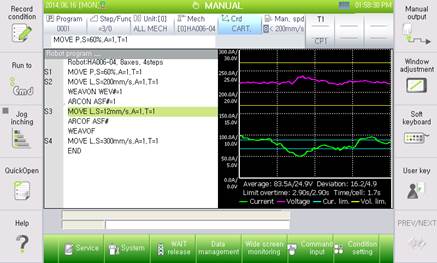
Figure 7.3 Arc waveform monitoring
(1) Average:
Averages of current values as well as voltage values. Values accumulated through one single welding process.
(2) Deviation:
Deviation in current values and voltage values. Values accumulated through one single welding process.
(3) Limit Overtime:
The time that the upper and lower limits for the current and the voltage are exceeded. Values accumulated through one single welding process
(4) Time/cell:
The graph shows the time of 1 cell. Currently, there are 4 cells, making it possible to check the results of welding performed for 10 seconds.