2.6. Test result - History graph
2.6. Test result - History graph
* This function is available only in V40.20-00 or later.
Clicking [F1: Service] → [7: System diagnosis] → [4: System fault diagnosis history graph] will display the following window for driving parts diagnosis history graph:

Figure 2.4 Initial window for driving parts diagnosis history graph
The graph will be displayed when you set the query period on the window.
Clicking [F1] or the period setting button will prompt the following popup window, in which you can set the period to be queried:
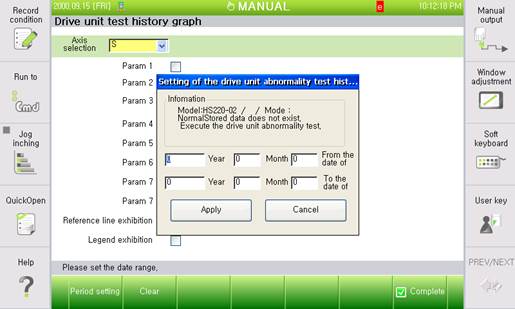
Figure 2.5 Popup display window for period setting
By default, the popup window automatically displays the first and the last dates of the saved data. Modifying the start and the end dates to be queried, and clicking the [Apply] button will call the data of the specified period as shown in the following figure, and the guiding message at the bottom will display the information on the current graph.
※ On the driving parts diagnosis history graph, by default, the columns between 'Disturbance dispersion' and 'Encoder temperature' are deselected.
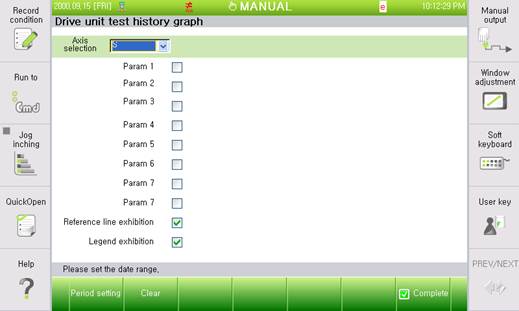
Figure 2.6 Initial window of the driving parts diagnosis history graph with successfulperiod setting
The displayed graph will be changed depending on the axis selection on the left of the graph, and on the selection of 'Disturbance dispersion' and 'Legend display'. As shown in the following figure, you can adjust the graph as desired.
※ In the driving parts diagnosis, data matching the conditions of selected axes and checkboxes may not exist depending on test setting.
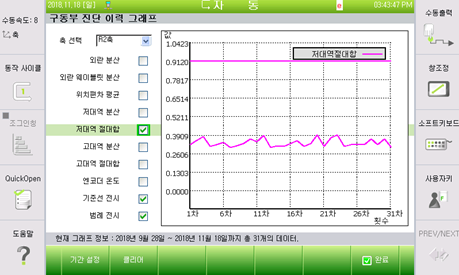
Figure 2.7 Example of graph window for the selection of axis R2 with low-band absolute sum