7.1. Diagnostic function
7.1. Diagnostic function
(1) When selecting a screen where the master module is mounted, bus error count and timeout count will be displayed as in [Figure 7.1], and error address (Node number of the slave that caused the error) will also be displayed. Current error code and code description in English will be displayed below. The first sentence will give the reason for the error, and the remaining sentences will be the countermeasures.
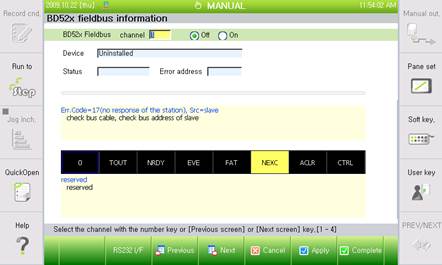
Figure 7.1 Diagnosis information of BD52x Fieldbus information and setting screen
(2) Global state bits will be displayed under the description, as in [Figure 7.2]. Black indicates that the bit is turned off, while yellow indicates that the bit is turned on. One of the bits is selected with a blue outline, and this indicates only that the help cursor is placed over the bit, and does not reflect the bit state. The help cursor is for indicating the meaning of each bit, and can be moved using the right and left arrow keys. The meaning of the bit where the help cursor is located will be displayed under the bit.
(The formation of global bits varies according to protocol. The example of [Figure 7.2] is a case of Profibus master.)

Figure 7.2 Global state bit

Figure 7.3 Diagnosis menu
(3) The number of disconnects or the number of retries for each slave will be displayed respectively by clicking 『[F3]: Disconnect』or 『[F4]: Retry』.
.
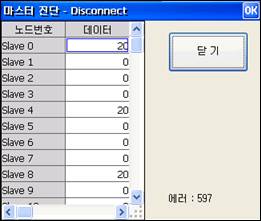
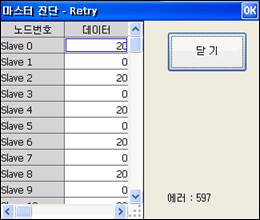
Figure 7.4 Disconnect dialog box and retry dialog box
(4) The slave table will be displayed as in [Figure 7.5] after clicking 『[F2]: Slave table』.
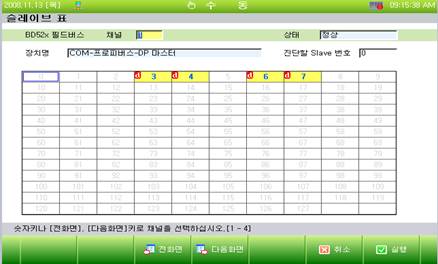
Figure 7.5 Fieldbus slave table
Table 7‑1 Meaning of the Node No. color for each slave
Indication | Description |
Blue number | Slave is registered on master using SyCon |
Yellow background | Slave performs communication with the master normally |
Red d | Slave has diagnostic information |
(5) In this context, diagnostic information is the record of fieldbus errors occurring on a specific slave device. The master can obtain diagnostic information from a slave and display it. For example, if slave of No. 3 node is indicated inversely to have diagnostic information, as in [Figure 7.6], the slave diagnostic screen can be displayed by inputting 3 on the number blank of slave to be diagnosed and clicking 『[F7]: Execute』.
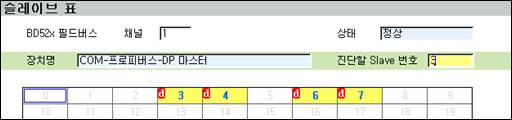
Figure 7.6 Input the Slave number to be diagnosed
(6) The slave diagnostic screen is the same as in [Figure 7.7]. Various slave status bits will be displayed on top of the screen. Like the global bit, yellow means that it is in ON status and the blue outline means that it has been selected by the help cursor. The meaning of a bit, which is shown in an inverse image, can be displayed by moving the help cursor with the arrow keys.
(7) The address of the master handling a corresponding slave and the identification number of the corresponding slave device will be displayed on the bottom of the screen.
(Screen arrangement varies according to protocol. The example on the picture above uses a Profibus master.)
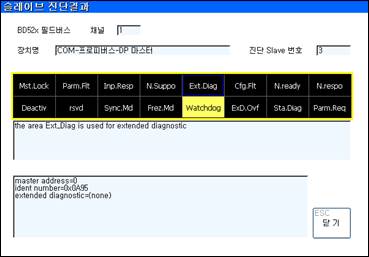
Figure 7.7 Slave diagnostics screen
(8) In this context, extended diagnostic information is the proper product information determined for each product (For example, measurement error of sensor device, faulty remote I/O device), not information defined in the Fieldbus as standard specification. Extended diagnostic information is displayed without any interpretation by receiving a column of hex data. Please refer to manual of the relevant slave product to determine the meaning.