4.1.Gas spring pressure test history graph
4.1.Gas spring pressure test history graph
* This function is supported after V40.20-00
(1) Clicking [F1: Service] → [7: System diagnosis] → [4: System fault diagnosis history graph] → [3: Gas spring pressure test history graph] will display the following window for gas spring pressure test history graph.
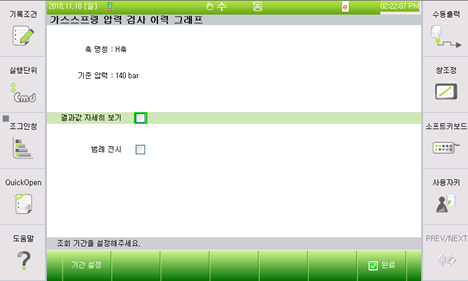
Figure 4.1 Initial window for gas spring pressure test history graph
(2) The graph will be displayed when you set the query period on the window.
Clicking [F1] or the period setting button will prompt the following popup window, in which you can set the period to be queried.
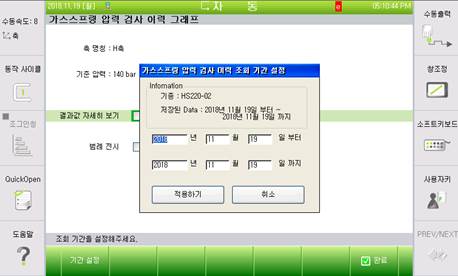
Figure 4.2 Popup display window for Period setting
(3) By default, the popup window automatically displays the first and the last dates of the saved data. Modifying the start and the end dates to be queried, and clicking the [Apply] button will call the data of the specified period as shown in the following figure, and the guiding message at the bottom will display the information on the current graph.
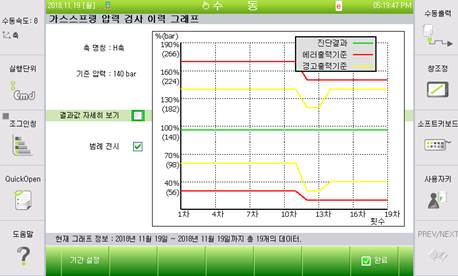
Figure4.3 Initial window for gas spring pressure test history graph with successful period setting
The gas spring pressure test history graph will be displayed in two lines indicating the maximum and minimum values of the error output criteria and the warning output criteria.
The displayed graph will be changed depending on the details view of result values on the left of the graph, and on the selection of legend display. You can adjust the graph as desired.