4.1. Brake test history graph
4.1. Brake test history graph
* This function is supported after V40.20-00
(1) Clicking [F1: Service] → [7: System diagnosis] → [4: System fault diagnosis history graph] → [1: Brake test history graph] will display the following window for brake diagnosis history graph:
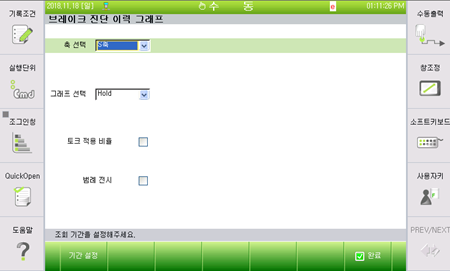
Figure4.1 Initial window for brake test history graph
(2) The graph will be displayed when you set the query period on the window.
Clicking [F1] or the period setting button will prompt the following popup window, in which you can set the period to be queried.
'Information' displays the model of the robot that is currently set and the time period in which the result of the model is saved.
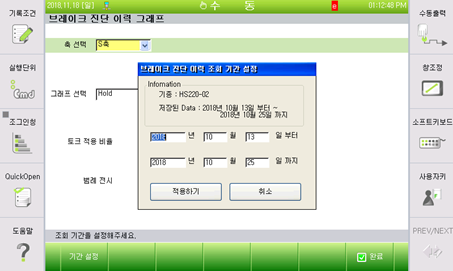
Figure 4.2 Popup window for setting query period
(3) By default, the popup window automatically displays the first and the last dates of the saved data. Modifying the start and the end dates to be queried, and clicking the [Apply] button will call the data of the specified period as shown in the following figure, and the guiding message at the bottom will display the information on the current graph.
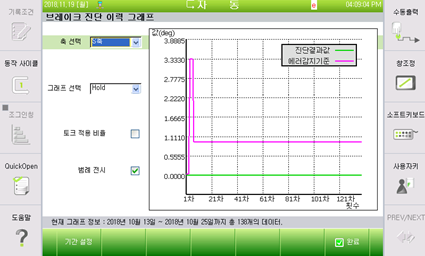
Figure 4.3 Window displaying the brake diagnosis graph
The displayed graph will be changed depending on the axis selection on the left of the graph, the selection of graph, the selection of the torque application ratio, and the selection legend display. You can adjust the graph as desired.
※ In the brake diagnosis, when changes are made in the axis and hold/release graph according to the testing setting, the data matching the conditions may not exist.